labs / 2026-09-22
Does sparse attention actually speed up video generation? — three conditions, measured
If you cut the attention computation in video generation, how much faster does it get, and what happens to the picture? We ran three conditions from an identical first frame so you can watch them side by side. Including the measurement trap we fell into, and the conclusion we had to withdraw halfway through.
What we found
5.7× from a standing start — of which sparsification is worth about 2×
Plain H3 at 20 steps takes 312.8s; with the turbo LoRA and sparsification it takes 55.0s. On sampling alone that is 9.19×. But the pieces do not add up — sparsification is worth 3.13× on top of 20 steps and only 1.96× on top of 4. Whatever you apply last gains least.
Cutting does make it faster — but it stops paying off
Going from 100% to 10% attention gives a 2.8× speedup. Halving again to 5% buys only 3–5% more sampling time. The same narrow range held across three configurations with different resolutions and frame counts.
Letting an AI allocate the budget is not the AI judging anything
We reversed only the meaning of the prose describing what each layer does, changing nothing else, and asked again. The allocation flipped cleanly. Repeating the identical question varies by 0.11 points; reversing the prose moves it by 6.49 points. The answer is set by whoever wrote the question.
Quality holds
Cropped at full resolution, the neon edges and the individual droplets of spray are still there. Six scenes in three conditions each, side by side, so you can judge it yourself.
The three conditions
All three start from an identical first frame, with the same seed and the same prompt. Left to right: nothing removed, AI allocating per layer, and a uniform cut at the same average. The right two are matched on average compute, so the only difference is how it is distributed.
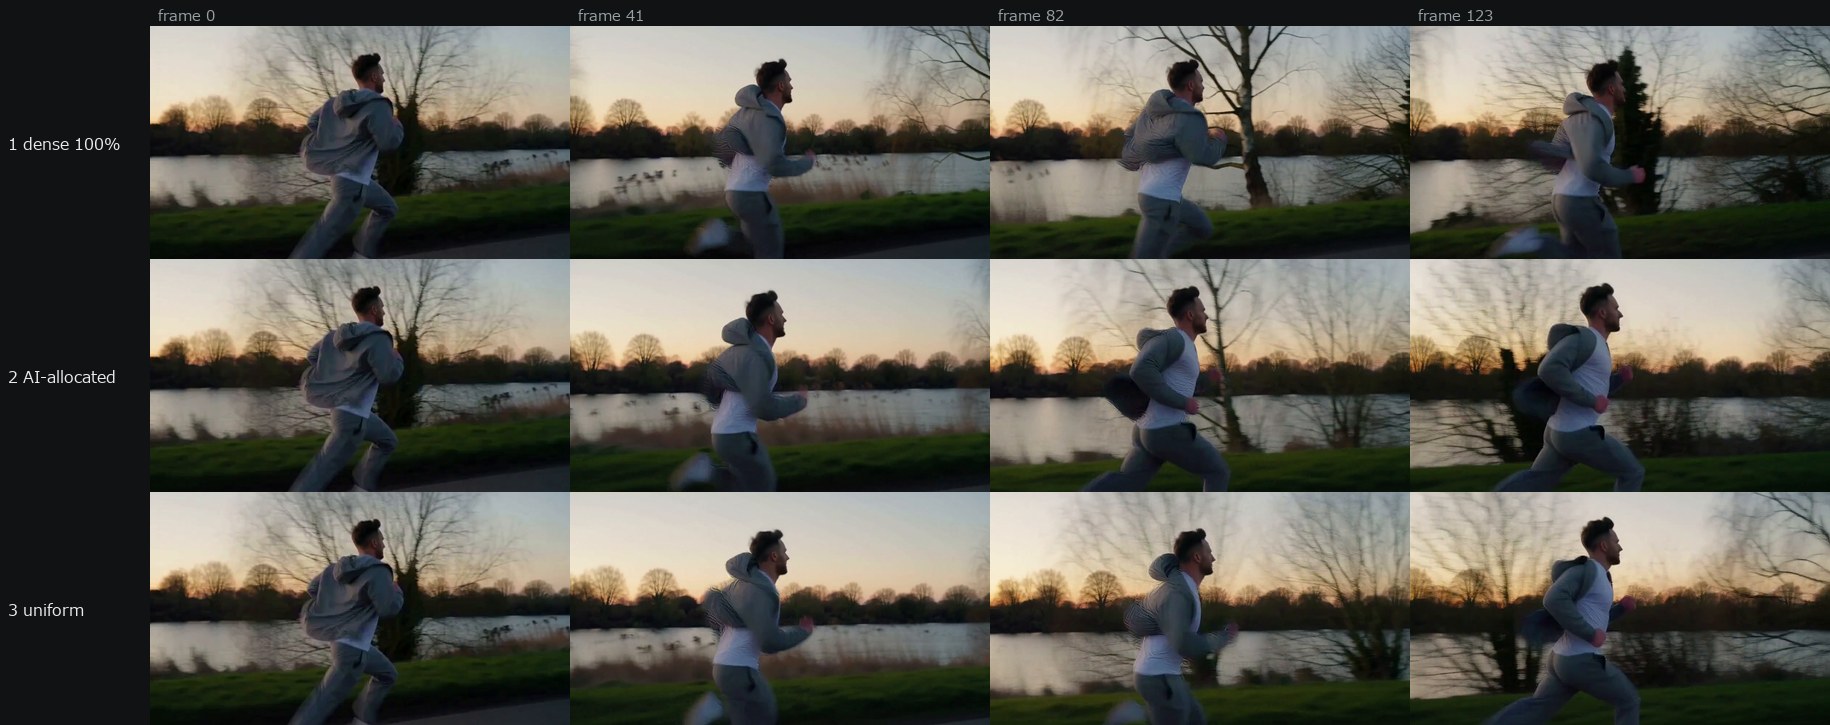
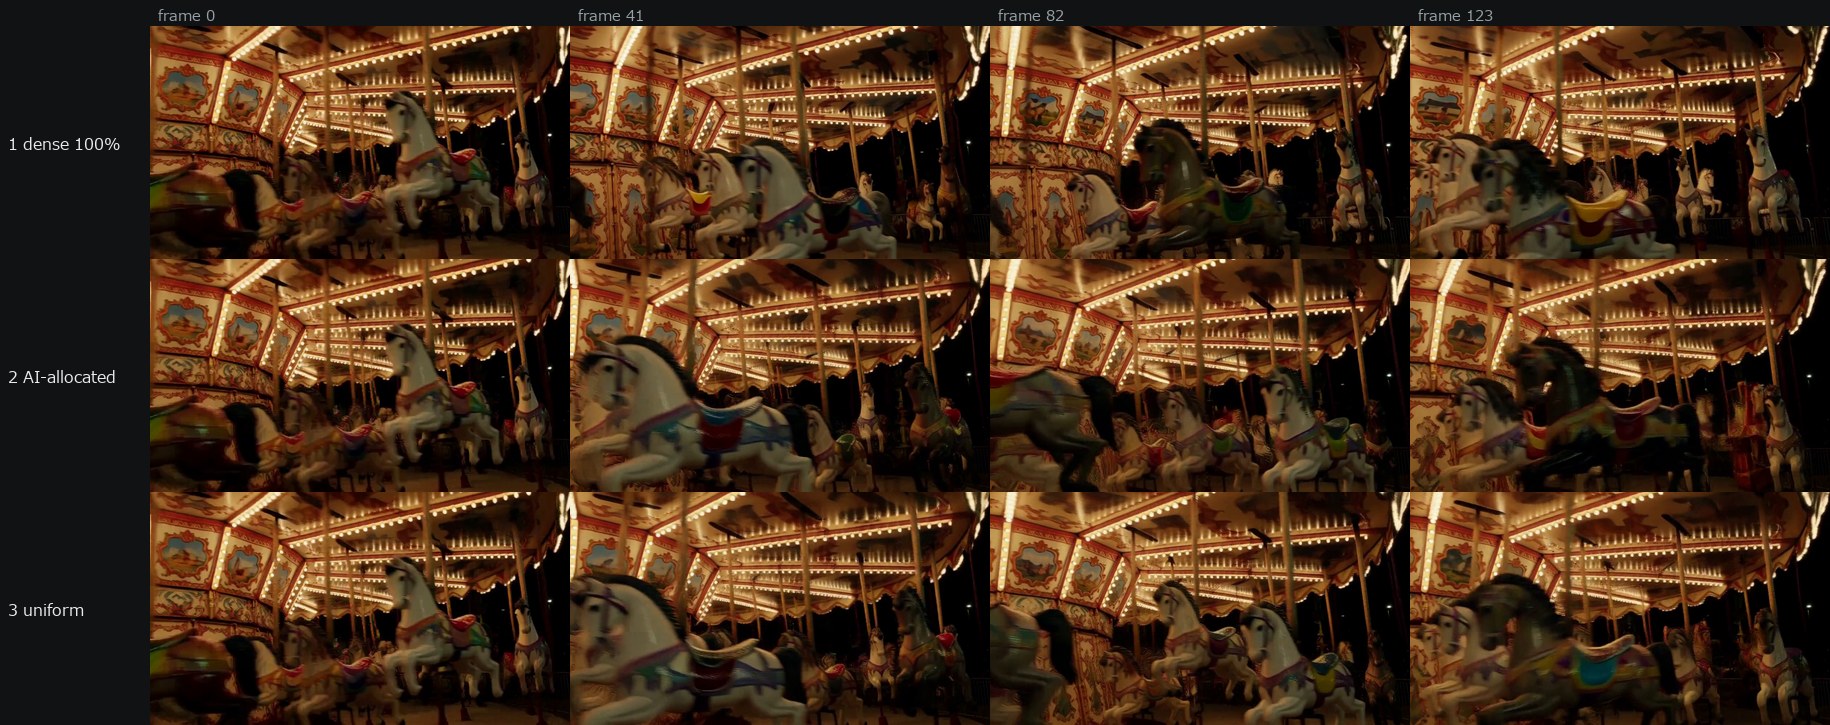
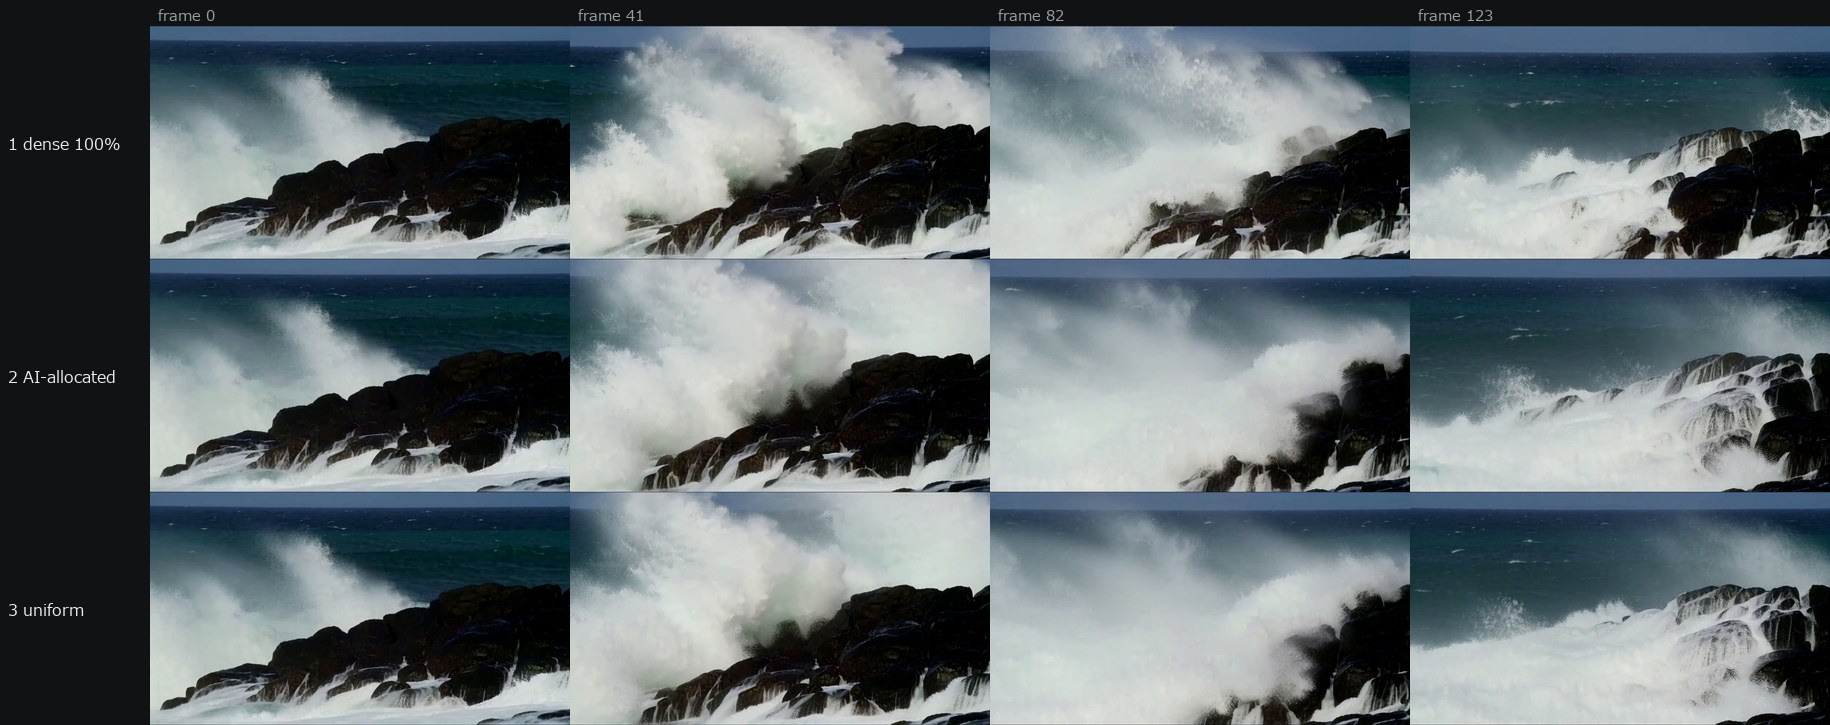
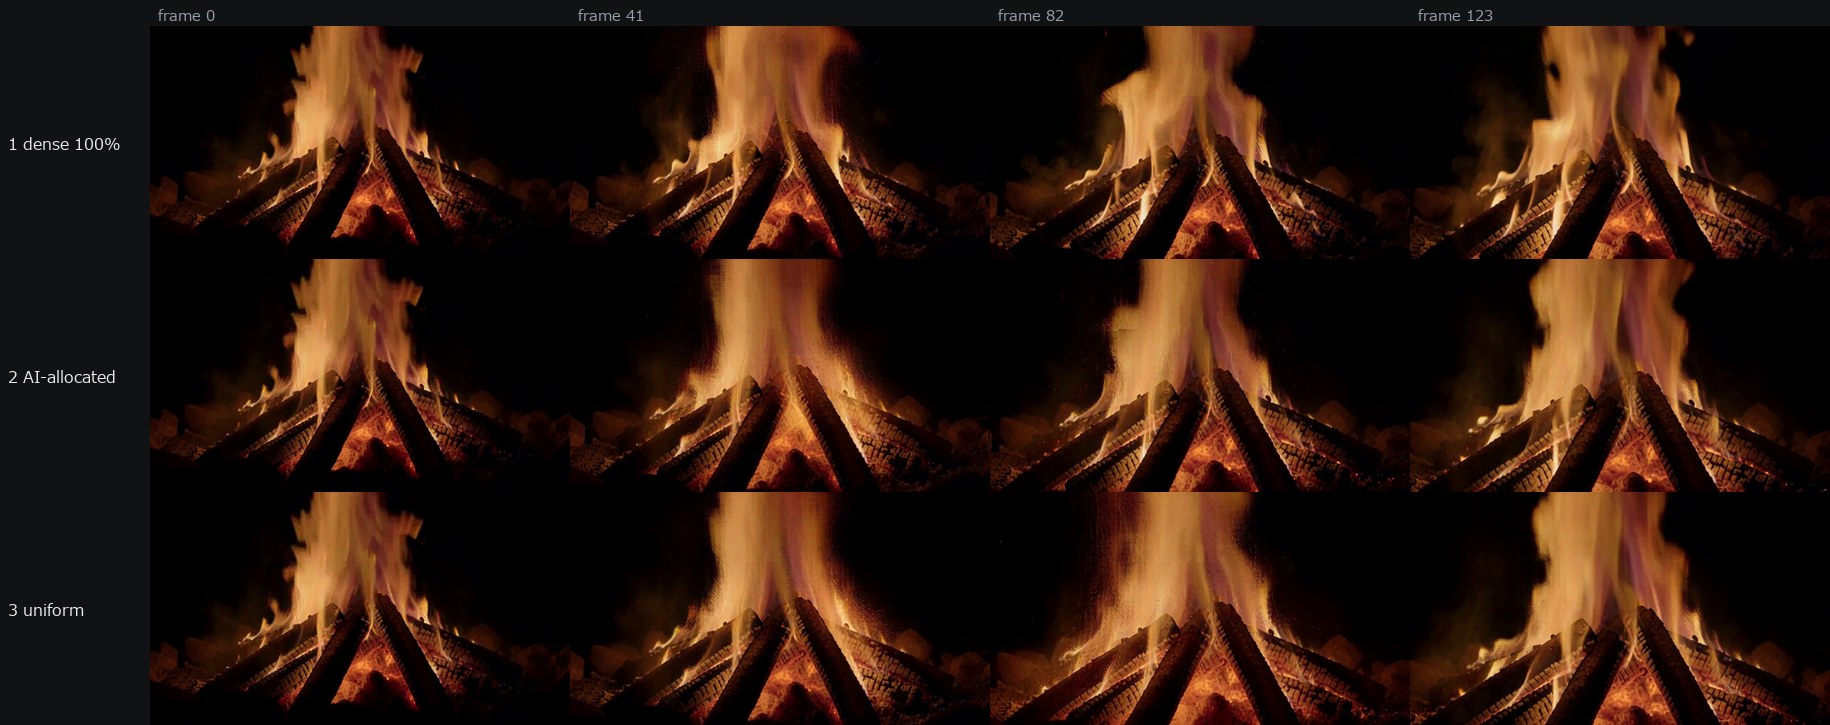
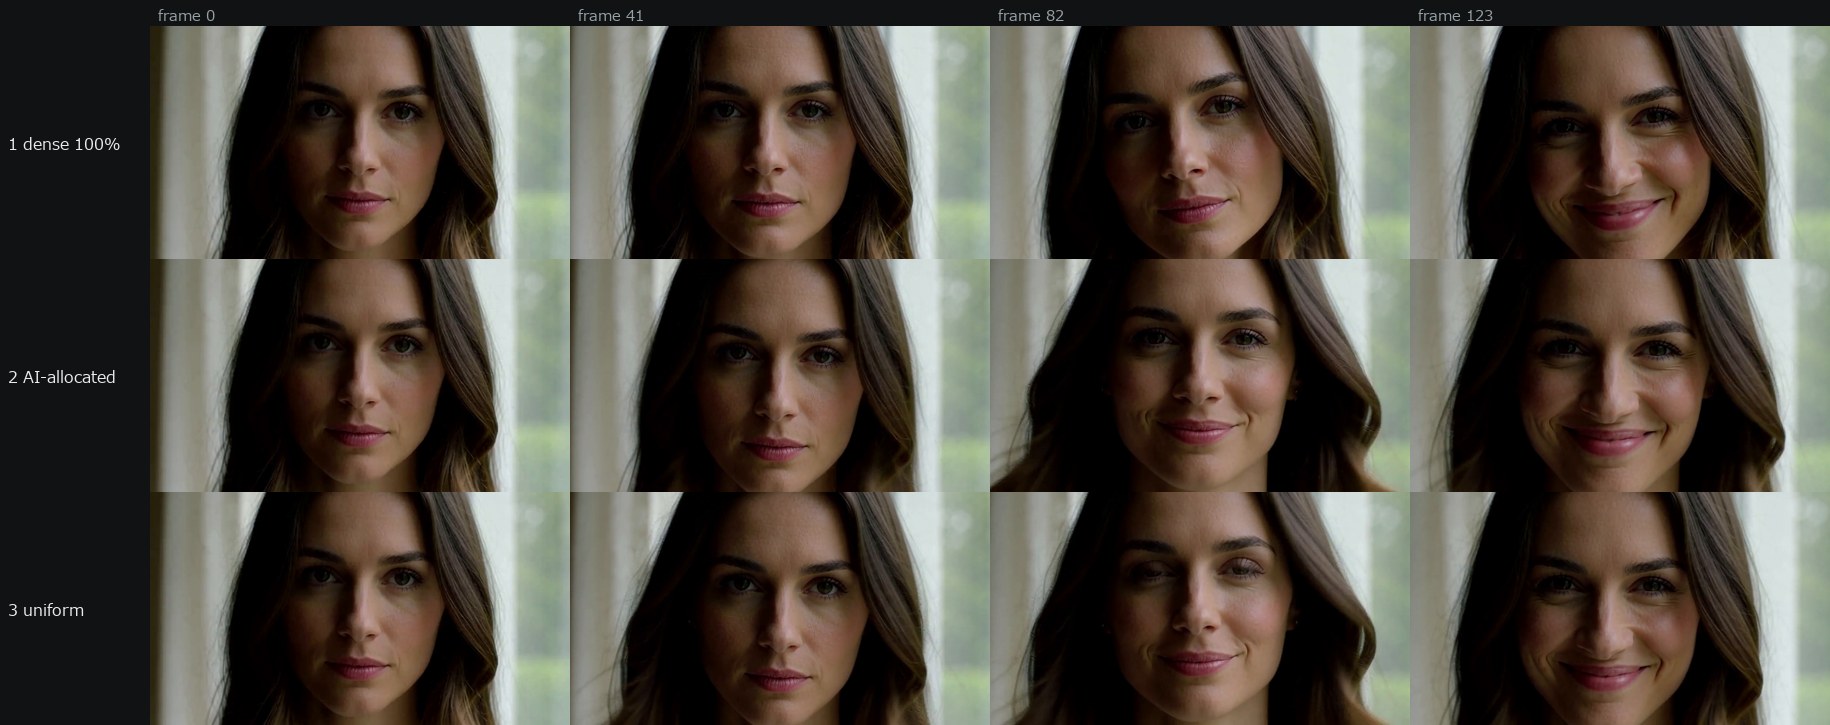
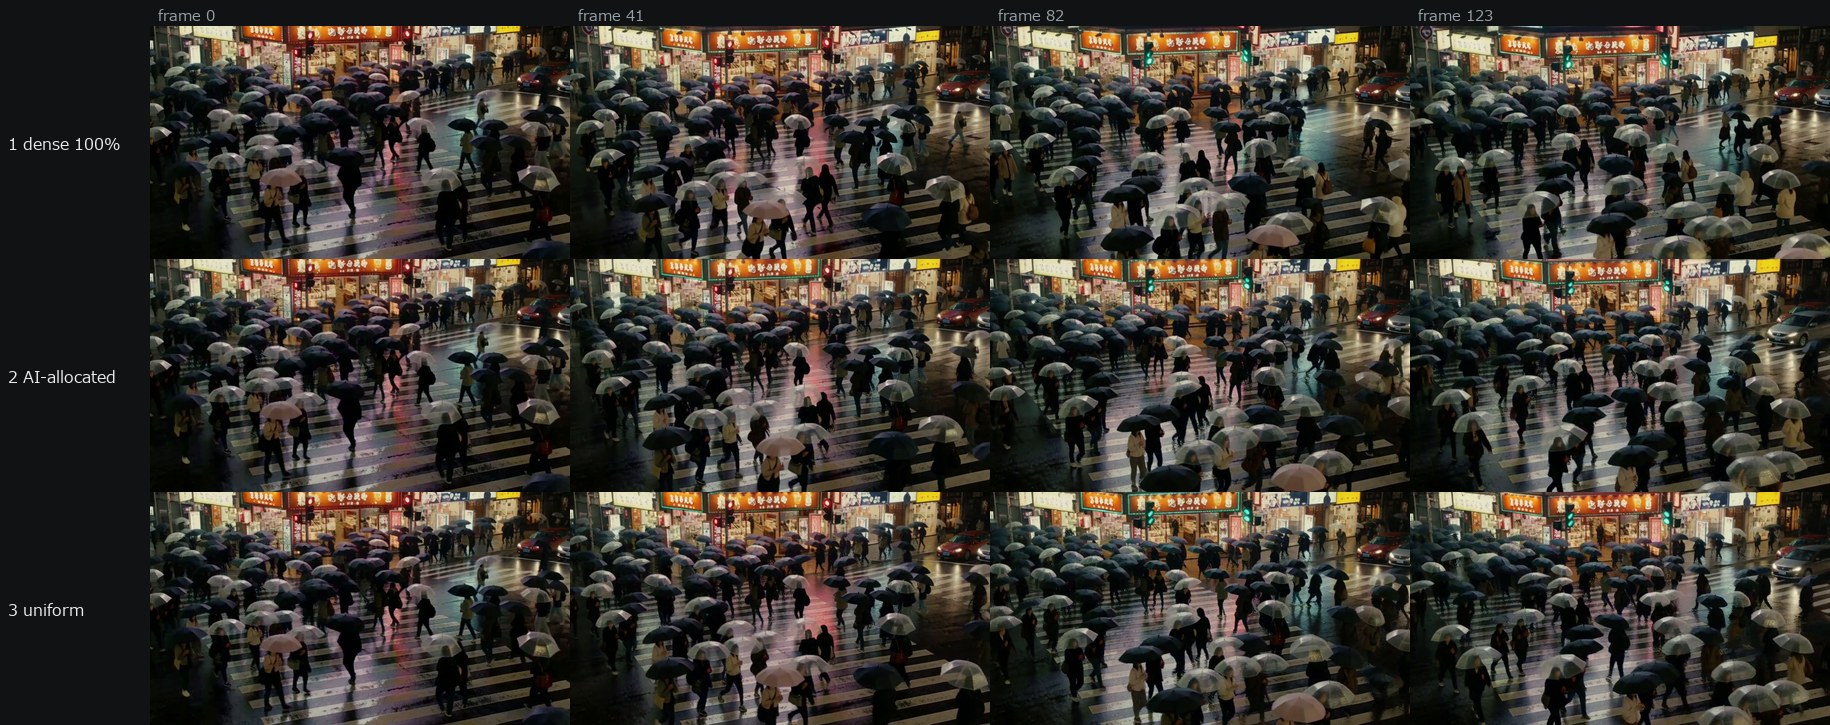
Audio is generated too, but these are muted by default since three play at once. Unmute one with its own volume control. We deliberately do not print a generation time on each clip. A single run of the same condition can vary by nearly 2× (see the measurement section), so a number next to each video would invite the wrong inference.
What is actually making it faster, and by how much
Every comparison up to here called "with the turbo LoRA already applied" the untouched baseline. So sparsification's 2× really meant 2× on top of something already sped up. We rebuilt the stack from nothing and measured what each piece contributes. Same subject, same seed, 1152×640, 124 frames. Sampling seconds are given alongside, to keep model loading out of the numbers.
| Setup | Sampling | Wall time | vs nothing |
|---|---|---|---|
| Nothing (no LoRA, 20 steps) | 290.5s | 312.8s | 1.00× |
| + sparsification only | 92.9s | 116.8s | 3.13× |
| + turbo LoRA only (4 steps) | 62.0s | 85.0s | 4.68× |
| + both (what we actually run) | 31.6s | 55.0s | 9.19× |
| (for reference) 4 steps without the LoRA | 58.4s | 91.2s | 4.98× |
1. The turbo LoRA does not make a step faster
Compare like for like at 4 steps: 62.0s with the LoRA, 58.4s without. The LoRA is actually 6% heavier. What it buys is not a faster step — it is needing 4 steps where you needed 20.
2. The pieces do not add up. Whatever you apply last gains least
Sparsification is worth 3.13× on top of 20 steps. Applied on top of 4 steps it is worth only 1.96×. The non-attention fixed cost per step grows as a share once the step count drops. The more you have already cut, the less the next thing buys you.
3. What you actually wait for is 5.7×
Sampling is 9.19×, but wall time goes 312.8s → 55.0s, which is 5.7×. The gap is everything outside sampling — VAE decode, video encode, saving — and it costs 22–33 seconds in every condition. That part does not shrink.
Other things we tried and did not keep
These are not the only ways to go faster. Here is what else we tried, and why it is not in the stack.
| Method | What you install | Effect | Verdict |
|---|---|---|---|
| Turbo LoRA (4 steps) | 1.82 GB | 4.68× | kept |
| Sparse attention (SLA) | 0 GB | 1.96–3.13× | kept |
| FastH3 8-step V2 | 20.61 GB | 1.41× at first, now slower | dropped |
| Spectrum | custom node | −28.2% (real) | dropped |
| EasyCache / LazyCache | custom node | 1.50× at 20 steps, nothing at 4 | dropped |
| torch.compile / SageAttention | — | could not measure | shelved |
Timing — where the seconds actually go
Our first conclusion was measured with the wrong ruler. Total generation time carries up to 11 seconds of variation unrelated to the condition (model reloading and so on) — the same size as the differences we were reasoning about. Isolating the sampling phase makes it clear.
What halving the keep rate buys you
Sampling moves −3 to −5% in all three. Total time scatters from +4.6% to −18.3%.
| Configuration | Sampling | Total |
|---|---|---|
| 1024x1792 124f | -3.0% | +4.6% |
| 1152x640 124f | -3.7% | -18.3% |
| 1152x640 192f | -4.9% | -2.2% |
Every measurement
| Condition | Mean keep | Sampling | Total | Everything else |
|---|---|---|---|---|
| A — DENSE (100%) | 100.00% | 284.72s | 339.0s | 54.28s |
| B — 固定 10% | 10.00% | 75.16s | 120.7s | 45.54s |
| C — 固定 7.93%(元事例のJev平均) | 7.93% | 79.84s | 133.8s | 53.96s |
| D — Jev-guided | 6.64% | 72.48s | 123.9s | 51.42s |
| P0 — 層別テスト(1/3/5/10を循環) | 4.75% | 72.91s | 126.2s | 53.29s |
| N_124f_dense | dense | — | 103.8s | — |
| N_124f_keep10 | 10.00% | 31.11s | 68.9s | 37.79s |
| N_124f_keep5 | 5.00% | 29.95s | 56.3s | 26.35s |
| N_192f_dense | dense | — | 158.7s | — |
| N_192f_keep10 | 10.00% | 47.07s | 82.8s | 35.73s |
| N_192f_keep5 | 5.00% | 44.75s | 81.0s | 36.25s |
Allocation buys no speed
With average compute matched, we alternated the two allocations and measured repeatedly. Outliers near 2× show up — but they show up in both conditions alike. The keep rates actually applied are byte-identical on fast and slow runs, so this is the environment, not the method. By median: AI-allocated 40.22s / uniform 37.56s. Changing the allocation does not change generation time.
| Run | AI-allocated | Uniform (same mean) |
|---|---|---|
| 1 | 35.78s | 35.00s |
| 2 | 40.22s | 86.86s |
| 3 | 70.07s | 37.56s |
| median | 40.22s | 37.56s |
Cutting nudges it brighter
All three start from the same first frame, so how far each one drifts from it is directly comparable. We measured brightness, contrast and saturation at frame 0 and frame 123; the numbers are the change.
| Scene | Condition | Brightness | Contrast | Saturation |
|---|---|---|---|---|
| Runner (leg cycle) | ① Nothing removed | -0.2 | -0.8 | -2.5 |
| ② AI-allocated | +7.5 | +5.5 | +0.0 | |
| ③ Uniform cut | +2.8 | +1.7 | +3.6 | |
| Carousel (rotation) | ① Nothing removed | +1.9 | +0.5 | -16.5 |
| ② AI-allocated | -3.2 | +1.2 | -4.9 | |
| ③ Uniform cut | -1.7 | +0.2 | -8.5 | |
| Breaking waves (high-frequency spray) | ① Nothing removed | +9.9 | -2.6 | -10.9 |
| ② AI-allocated | +25.2 | -5.2 | -27.0 | |
| ③ Uniform cut | +29.9 | -3.7 | -29.5 | |
| Campfire (chaotic flicker) | ① Nothing removed | +11.2 | +7.1 | +20.8 |
| ② AI-allocated | +14.9 | +8.4 | +31.8 | |
| ③ Uniform cut | +14.6 | +9.2 | +30.5 | |
| Close-up face (identity, blink) | ① Nothing removed | -2.8 | -1.1 | -0.7 |
| ② AI-allocated | -9.5 | -1.4 | +4.9 | |
| ③ Uniform cut | -3.4 | +1.7 | +2.7 | |
| Crowded crossing (many small objects) | ① Nothing removed | +10.4 | +2.0 | -8.8 |
| ② AI-allocated | +7.7 | +3.8 | -4.1 | |
| ③ Uniform cut | +4.8 | +2.7 | -5.7 | |
| mean of 6 | ① Nothing removed | +5.09 | +0.86 | -3.09 |
| ② AI-allocated | +7.09 | +2.04 | +0.13 | |
| ③ Uniform cut | +7.85 | +1.96 | -1.16 |
One clip per scene, so this is a tendency and nothing more.
The AI looks like it is judging. It is not
The conclusion first. Ask an AI to decide where the compute should go and you get an answer that looks considered. But it was only tracing back the description we had written into the question ourselves. The AI never sees the thing it is budgeting for.
How we checked
Inside the model that makes the video there are 50 processing stages. We asked the AI, one stage at a time, how much compute that stage deserves. And in asking, we attach our own description — “this one is near the input”, “this one is near the output”.
What came back: less near the input, more near the output. Plausible enough.
So we swapped those descriptions and nothing else, then asked exactly the same thing again. The options, the stage numbers and every other word stayed identical. We simply told the input-side stages they were near the output, and the output-side stages they were near the input.
| Layer position | Original description | Descriptions swapped | Difference |
|---|---|---|---|
| layers 0–9 | 3.13% | 9.62% | +6.49 |
| layers 10–19 | 3.52% | 8.38% | +4.86 |
| layers 20–29 | 6.97% | 6.66% | -0.31 |
| layers 30–39 | 9.38% | 4.42% | -4.96 |
| layers 40–49 | 10.00% | 4.00% | -6.00 |
Take only the answers the AI gave confidently and you get 3 / 3 / 8.3 / 10 / 10 against 10 / 10 / 8.3 / 3 / 3. An exact mirror image.
So the answer was set by whoever wrote the question, not by the AI. It has no idea what those 50 stages actually do; all we can hand it is a position and a description we wrote ourselves.
It is not oblivious, though. Feed it a description that contradicts the stage number and its confidence drops noticeably (the share where it gave up and fell back to the default went from 17% to 43%). It still follows the description.
How this was measured
MiniMax H3 (1024×1792 and 1152×640, 124/192 frames, 4 steps, er_sde, a 4-step turbo LoRA) on an RTX 5080 16GB. Sparsification uses the SLA path already shipped in ComfyUI — the fraction of key blocks each query block keeps. No ComfyUI source was modified; we added one small node whose only job is to swap the ratio per step and per layer.
The three comparison clips are handed an identical first frame. Sparsification changes the computation itself, so the same seed no longer produces the same picture; without a shared starting point you are just looking at three different videos.
For what it is worth, a generative model returns the same output every time when the settings and the seed are all identical (we re-ran one condition unchanged and measured a pixel difference of 0.00). Change any one setting — sparsification, step count, anything — and what comes out is different. That is why the three clips are three different pictures.
The clips are not re-encoded. Re-compressing footage on a page about image
quality would make it impossible to tell whether you are seeing sparsification or the codec. Only
the container was rewritten (-c copy) so playback can start before the file finishes
downloading.
Source data
Every number on this page comes from logs written automatically during generation. None were retyped by hand.
- Every run auto-saves the keep rates actually used (4 steps × 50 layers = 200 slots) and the sampling seconds as JSON
- Generation time comes from ComfyUI's own execution start/finish timestamps
- All six rounds of questions and answers to the AI (with confidence) are stored too
- The charts are built from those JSON files